One of the first questions any operations manager or CFO asks when a photovoltaic project is presented is always the same: how long until I recover my investment? The answer is not a single universal number, but in Argentina the typical range for medium to large-scale industrial and commercial installations falls between 3 and 5 years.
Below that threshold, practically no comparable-risk financial instrument offers similar returns. Above 6 years, the equation starts to depend too heavily on macroeconomic variables. Below we explain what factors move that number and how to optimise it.
The 4 factors that define the payback
1. The current electricity tariff and its trajectory
The annual savings from a solar system are directly proportional to the cost of electricity no longer purchased. In Argentina, industrial tariffs (BT3, AT2 and AT3 categories under the ENRE/EPRE system) have been rising steadily, with cumulative increases exceeding 400% between 2022 and 2024.
This has a direct consequence on payback: a system sized in 2022 already has a shorter recovery period today than originally projected, simply because tariffs rose faster than the initial analysis anticipated. Solar energy acts as a natural hedge against tariff inflation.
The average cost of industrial energy in Argentina in early 2025 — including capacity charge, energy consumed, fixed charge and distribution — ranges from ARS 95 to ARS 145 per kWh depending on the province, supply voltage and demand profile.
2. Solar irradiation at the site
Not all provinces receive the same amount of sunlight. Global horizontal irradiation (GHI) varies significantly within Argentine territory:
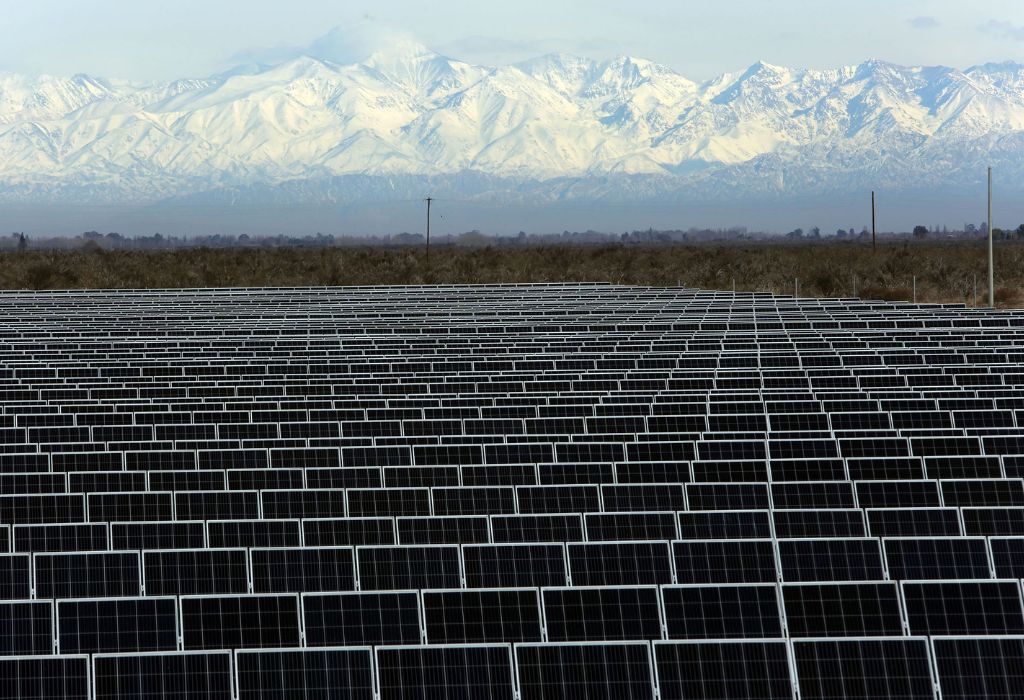
- Cuyo and NOA (Mendoza, San Juan, Salta, La Rioja): 5.5–6.5 kWh/m²/day — among the sunniest zones in the world.
- Central (Córdoba, La Pampa, San Luis): 4.8–5.5 kWh/m²/day — excellent resource.
- Litoral and AMBA (Buenos Aires, Santa Fe, Entre Ríos): 4.3–5.0 kWh/m²/day — good resource, viable projects.
- Northern Patagonia (Neuquén, Río Negro): 4.5–5.2 kWh/m²/day — underutilised potential.
The irradiation difference between Mendoza and Buenos Aires means that, with the same installed capacity, a system in Cuyo can generate up to 30% more annual energy, proportionally shortening the payback.
3. System size and economies of scale
In solar energy, as with most capital investments, the unit cost falls as the project scales. A 500 kWp system can be installed at a cost of USD 650–750 per kWp, while a 50 kWp one can reach USD 950–1,100 per kWp. This means large industrial and commercial projects have a structurally better payback than small installations.
4. Grid injection under Law 27.424
When a company joins the distributed generation scheme, surpluses produced during low-demand periods (weekends, holidays, nighttime) are not lost: they are credited on the next bill as an energy credit. This system usage optimisation can improve total utilisation by 15% to 25%, reducing payback by 6 to 18 months compared to an installation without grid injection.
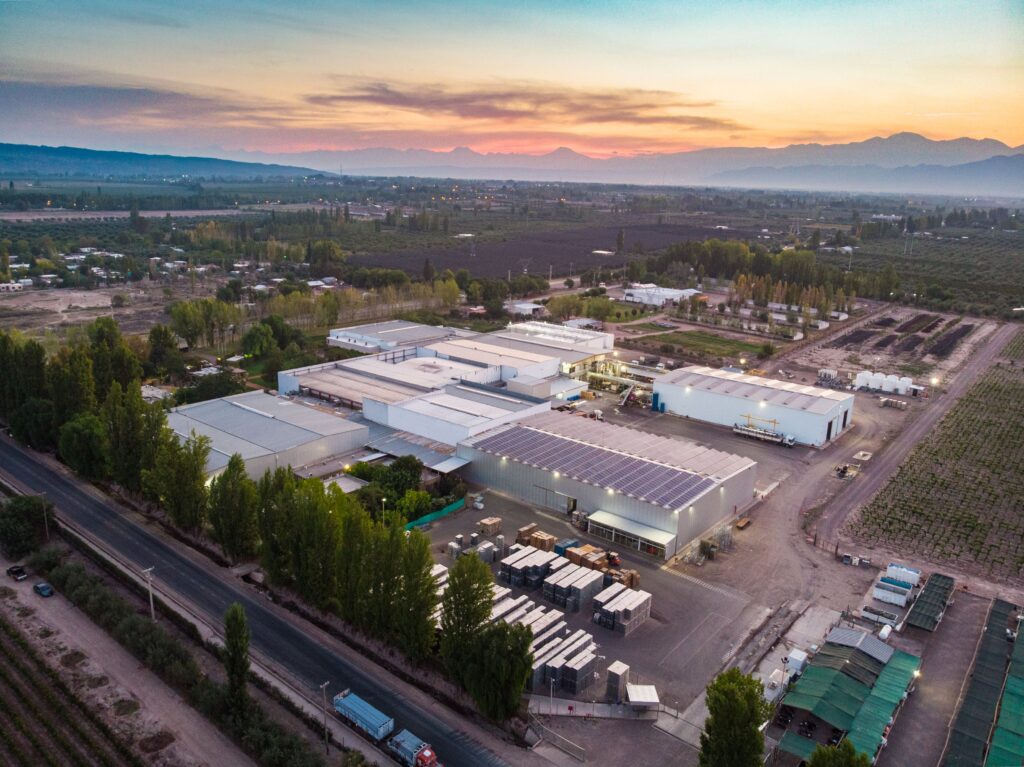
Real case: 300 kWp industrial facility in Mendoza
To illustrate with concrete figures, we analyze a real Energe project: a light manufacturing industrial plant in the Maipú industrial corridor, Mendoza.
| Parameter | Value |
|---|---|
| Installed capacity | 300 kWp (680 panels of 440W) |
| Total investment (equipment + installation) | USD 210,000 |
| Estimated annual production | 522,000 kWh/year |
| Average AT2 tariff applied | ARS 110/kWh (ref. Jan 2025) |
| Annual savings in pesos | ARS 57,420,000 |
| Annual savings in dollars (ref. exchange rate) | ≈ USD 55,000 |
| Simple payback | 3.8 years |
| System useful life | 30 years |
| Estimated IRR (30-year horizon, in USD) | 28% per year |
* ARS values are January 2025 reference. Nominal savings in pesos grow with tariff inflation, further shortening the real payback. The USD IRR reflects the analysis at constant exchange rate.
"A 28% annual IRR in dollars for a low-risk asset with a manufacturer's production guarantee for 30 years is hard to beat with any other instrument available in the Argentine market."
What happens after the payback?
This is the part that surprises executives who are new to solar technology. Once the investment is recovered — at 3.8 years in the example — there are more than 26 years of virtually free generation remaining. First-tier panels guarantee 80% of their original output at 30 years of use. The only recurring cost is annual preventive maintenance, which runs about 1–2% of the investment cost.
In terms of net present value (NPV at 8% annual USD rate), the example project yields a positive NPV of more than USD 400,000 at the end of its useful life.
Available financing options
A solar investment does not require full upfront payment. There are instruments that allow you to start the project with positive cashflow from day one:
- FODIS: the Distributed Generation Fund provides subsidised-rate loans for projects under Law 27.424. Applies to individuals and legal entities.
- Financial leasing: the monthly instalment is structured to equal or be less than the savings generated by the system, making the investment self-financing from day 1.
- PPA (Power Purchase Agreement): the installer finances, installs and maintains the system; the company pays only for the energy generated at a fixed price, always below the grid tariff. No upfront investment required.
- Renewable investment funds: private vehicles oriented to medium-scale distributed generation projects.
Conclusion
The payback in industrial solar energy is not a promise: it is the inevitable mathematical result of energy costs and the guaranteed production of the system. In a context of steadily rising tariffs like Argentina's, every month without making the decision represents a real and quantifiable opportunity cost.
If your company's monthly electricity bill exceeds ARS 2,000,000, investing in a photovoltaic system is probably the most profitable financial decision you can make this year.